
Gnuplot
Gnuplot is a command-line oriented tool for creating graphs. Both 2D and 3D plots are supported as well as many output formats.
Gnuplot file:
set title "Jobs in 2008" set xlabel "Month" set ylabel "Jobs" set terminal png set output 'graph.png' set yrange [0:] plot 'example.data' using 1:2 |
Data:
# Month   Jobs
     01   2211
     02   2350
     03   2855
     04   1843
     05   2476
     06   4190
     07   4195
     08   6152
     09   4922
     10   8234
     11   5666
     12   3286
|
Output: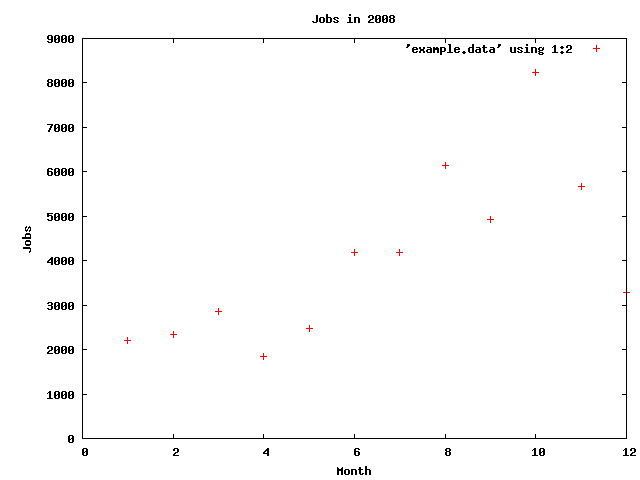 |
|