Energy Balances and Environmental Indicators
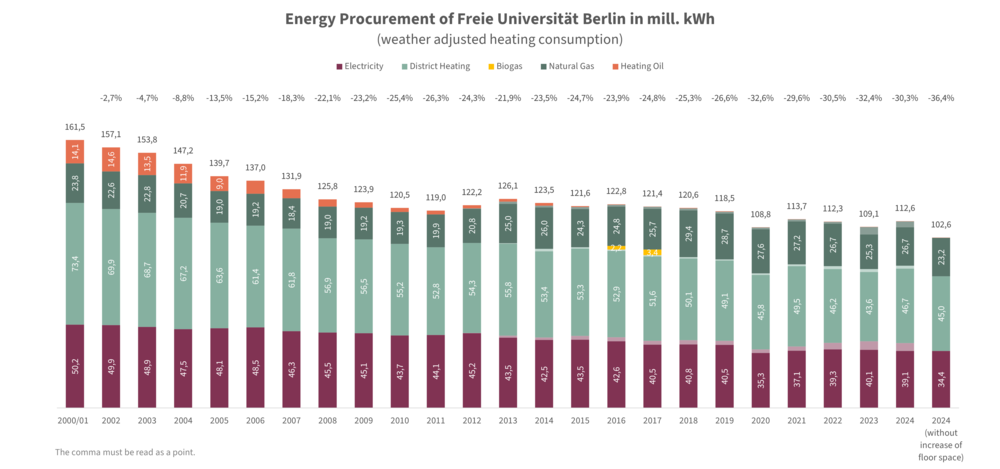
Freie Universität Berlin reduced annual energy consumption by over 26% (or about 41 million kWh) between 2000/2001 and 2011 through various technical, structural, organizational, and behavioral measures. Since 2012, energy consumption has hovered around this level with minor fluctuations and a slight increase in building area and has recently been rising again.
Energy
In 2024, Freie Universität consumed around 113 million kWh of electricity and heat. This was one of the lowest consumption in the last 24 years and represents a decrease of 30 percent. Excluding the increase in space since 2012, the university's energy consumption actually fell by 36 percent between 2000/01 and 2024. In view of the significant increase in student numbers and third-party funding since 2010, this development is exemplary in the German university landscape.
Emissions
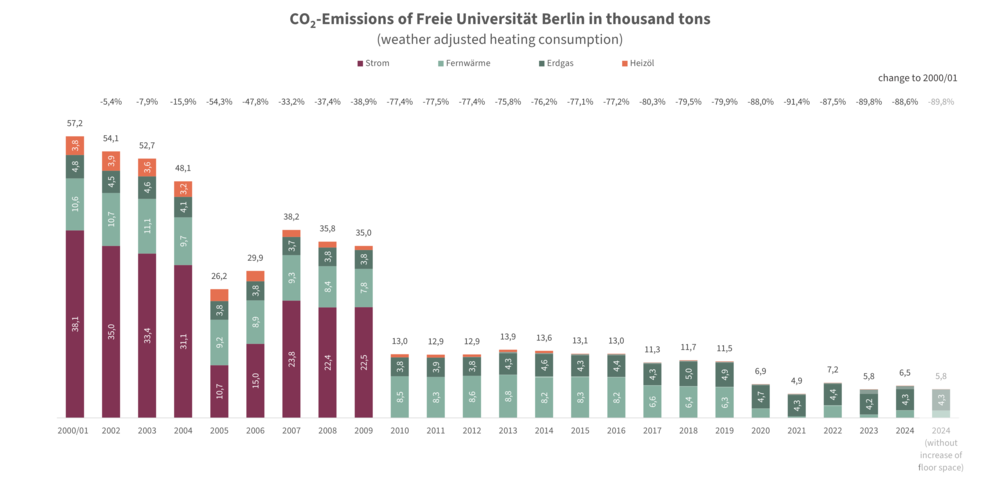
Considering CO2-free electricity since 2010, CO2 emissions decreased by almost 90 percent from 57,200 tons to 6,500 tons, including the area increase. Excluding area growth, CO2 reduction is over 91 percent.
The current energy procurement balance and the CO2 balance are as follows:
Total energy consumption of the FU Berlin from 2000 to 2024
CO2 Balance and Reduction in Heating Consumption of FU Berlin from 2000 to 2024
Energy: consumption and costs 2024 (provisional, data not yet finalised)
- 112,570,000 kWh (-30% compared to 2000/01, weather-adjusted, incl. increase in floor space)
- 102.640.000 kWh (-36% compared to 2000/01, weather-adjusted, without increase in floor space)
- 23,7 million €
- Energy costs saved since 2002 (cumulative): 84.018.000 €
CO2: energy-related GHG emissions 2024 (provisional, data not yet finalised)
- 6.500 t CO2 (-89% compared to 2000/01, incl. area growth)
- 5.800 t CO2 (-90% compared to 2000/01, without increase in area)
Measurement of greenhouse gas emissions in the carbon footprint (2021-2023):
2022
|
|
2023 |
|
2024 |
|
|
SCOPE 1 |
4,686 tCO2e |
SCOPE 1 |
5,182 tCO2e |
SCOPE 1 |
5,022 tCO2e |
|
SCOPE 2 |
2,568 tCO2e |
SCOPE 2 |
706 tCO2e |
SCOPE 2 |
1,584 tCO2e |
|
SCOPE 3 |
2,423 tCO2e |
SCOPE 3 |
3,515 tCO2e |
SCOPE 3 |
No data available |
|
TOTAL |
9,677 tCO2e |
TOTAL |
9,403 tCO2e |
TOTAL |
Not analyzable |
The goal of climate neutrality by 2025 includes CO2 emissions from Scope 1 and Scope 2 as well as emissions from business trips.
Scope 1 emissions are based on the purchase of natural gas (with biogas content) and heating oil and the energy use of the vehicle fleet. Scope 2 emissions are based on district heating with fluctuating CO2 factors.
Scope 3 emissions include emissions from business trips, commuter traffic and paper consumption.
The carbon footprint for electricity, district heating and natural gas is based on the CO2 data from the supply contracts and energy suppliers. The CO2 factors for business trips and the vehicle fleet are based on UBA data.
Further data can be found in our environmental statement (only available in german).
Water: consumption and costs 2024 (provisional, data not yet finalised)
- 240.800 m3 (-14% compared to 2004)
- 1,41 Mio. €
Waste: Volume and costs 2024
- 519 t residual waste
- 54,4 tons of hazardous waste
- approx. 439,000 €
*The figures for 2024 are not yet finalised
The data presented relates to the entire building stock of Freie Universität, including the Botanic Garden. The heat consumption contained in the data was weather-adjusted on the basis of heating degree values.
CO2 factors 2024 according to energy supply contracts: Electricity: 0 g/kWh (CO2-free electricity purchase since 2010), district heating: 33,9 g/kWh, natural gas: 185 g/kWh (16.8% biogas share), heating oil: 266 g/kWh.
If you have any questions about the data presented here, please contact the Sustainability & Energy team: nachhaltigkeit@fu-berlin.de.


